How to Make a Fortune in the Electric Vehicle Boom Without Selling a Single Car
SEPTEMBER 5, 2017
The dogs didn’t cost much. They were strays, purchased for the grand sum of 25 cents. That made the executions cheap.
After securing the dogs, legendary inventor Thomas Edison and his people would gather reporters, rig the dogs to wires or metal plates, and turn on the electricity. Electrocution was almost immediate.
It was the 1880s, and Edison believed the gruesome spectacles would make a powerful point: His rival George Westinghouse’s method of delivering electricity to homes and businesses – called alternating current (AC) – was too dangerous. Edison used alternating current to electrocute the dogs. If AC could kill dogs quickly and easily, it could do the same to people.
It was in Edison’s best interest to convince people that Westinghouse’s alternating current method (created by genius inventor Nicola Tesla) was dangerous. Edison had his own competing method, called direct current (DC), to sell. It was the dawn of the electric age. The world was just starting to transition from candles to lightbulbs, and the American market’s potential was incredible.
But who would capture it? Edison and direct current? Or Westinghouse and alternating current? The winner of this war – now called The War of Currents – would dominate the American electricity market, acquire great power, and make a huge fortune. It’s one of the greatest industrial wars in American history.
With Thomas Edison, George Westinghouse, and Nicola Tesla in the mix, the War of Currents was fought by some of history’s greatest technological and business minds. Their weapons were public spectacles, patents, lies, and lawyers. To put it in a modern-day context, it would be like Elon Musk and Steve Jobs (when he was alive) fighting viciously in the press and in the courts over the same market.
In addition to frying dogs in front of reporters, Edison and his people were involved in America’s first use of the electric chair. They ensured alternating current – delivered via a Westinghouse generator – was used in the August 6, 1890 electrocution of axe murderer William Kemmler. Edison used Kemmler as he used the dogs. He wanted the public to associate his rival’s technology with death. Edison and his staff even promoted the idea of referring to electrocution as getting “Westinghoused.”
In the end, Westinghouse and Tesla won the War of Currents. Tesla’s was a superior technology. It was safe and effective. It was also cheaper to install and maintain than direct current. To this day, alternating current powers homes around the world.
After the War of Currents, the electrification of the world went on to become a pivotal phase in human history. It fundamentally changed the way people work and live. It made indoor lighting, televisions, radios, dishwashers, iPhones, and computers possible.
It also consumed tremendous amounts of copper.
Copper is one of the world’s most useful elements. It naturally occurs as an extremely ductile, malleable metal with very high thermal and electrical conductivity. This is a fancy way of saying it is extraordinarily useful. Copper has been used for than 5,000 years to make tools and weapons. Just as human history has a Stone Age, it also has a Copper Age.
In modern times, copper is a widely used ingredient in plumbing and construction. But it played – and continues to play – a key role in the story of electricity because it’s the preferred metal for making electrical wires and electric motors. You could say the age of electricity is also the new copper age.
In the 125 years since the War of Currents, the world has worked its way to annually consuming 50 billion pounds of copper. Over the past 20 years, annual demand has doubled… increasing at a rate of 3.14% per year.
However, I believe that the amount of annual copper consumption is about to change in a big way. I believe that over the next 25 years, widespread adoption of electric vehicles will result in another doubling of annual copper demand. In this month’s issue, I’ll detail my favorite ways to profit from the coming copper consumption boom. I’ll also cover our next gold stock investment.
A Historic Battle Begins
In December 2016, General Motors began selling of the most important cars in its 108-year history, the Chevy Bolt.
In addition to being significant for the iconic American automaker, the introduction of the Bolt was a landmark event in the history of electric cars. The Bolt was the world’s first low-priced, mass-market car with a range of more than 200 miles.
For a long time, electric car makers have seen this feature – the ability to run 200 miles before requiring a recharge – as critical to the “revolution”: the widespread adoption of clean, emission-free electric cars.
A driving range greater than 200 miles is critical because of something called “range anxiety.” Range anxiety is the fear drivers get from knowing the battery in their electric car could run of out of charge… and leave them stranded far away from a charging station. As electric vehicles have grown in popularity over the past decade, the term has become an obsession in the auto industry.
In fact, you could say the race among electric carmakers like GM, Tesla, and Nissan is the race to become the world champion of overcoming range anxiety. A big breakthrough in treating this “disorder” would be worth hundreds of billions of dollars. It would set the winner up to dominate the future of cars.
Although electric cars have come a long way over the past decade, they are still light years behind internal combustion engines when it comes to fueling infrastructure. Batteries drain quickly and they must be recharged. Most gasoline-powered cars enjoy ranges of over 300 miles, while for years, affordable electric cars had limited ranges of less than 100 miles. (Tesla’s famous Model 3 has a range greater than 200 miles, but it’s also out of the average buyer’s price range.)
A limited number of miles per battery charge is a big deal because regular gas stations are much, much more common in most places than charging stations. In most areas, the guy leaving his driveway in an electric car has a lot less options for refueling than the guy in a Chevy Suburban.
You might want to do your part to save the Earth, but if doing that means constantly worrying about getting stranded with a low battery, you’ll probably choose the gas guzzler.
This aspect of owning electric cars is the biggest obstacles to their widespread adoption. Most folks choose not to deal with “range anxiety,” so electric cars command only a tiny percentage of the U.S. auto market.
However, some of the world’s smartest people are working on overcoming this obstacle. They have access to billions of dollars in capital to further research and development. After all, they know a big breakthrough in EV technology will put them in a position to dominate the future of the car industry… while enjoying all the power and profit that will come with that position.
With the Bolt, GM won an early battle. But with Tesla, Nissan, BMW, and others entering the fray, this war – which will go down as one of history’s greatest business wars – is far from over.
In the pages that follow, we’ll analyze the huge potential of Electric Vehicles and the investment opportunities they will create. The good news is that you don’t have to try to pick a winner from among the ever-changing technology leaders. You can simply sell every EV maker copper, a material they must all consume in huge quantities for decades in the future.
Electric Vehicles: On the Cusp of a Super Boom
In addition to earning a spot in automotive history, the Chevy Bolt is getting great press in the car industry. It was named the 2017 Motor Trend Car of the Year. The popular car reviewer said, “The groundbreaking Chevrolet Bolt EV is the car of tomorrow. Today.”
Another electric car to win a recent Motor Trend Car of the Year award is the Tesla Model S. Motor Trend said the Model S was a “truly remarkable automobile.”
Because of favorable press and climate change concerns, sales of electric cars are starting to boom… and they’ll continue to boom in the future.
Just 10 years ago, there were virtually no electric cars on the road. In 2017, an estimated 1 million new electric vehicles will be sold. This science experiment is now the real deal, and it is changing the car consumer mindset. Below is a chart that shows the enormous increase in EVs on the world’s roads since 2010.

A driving factor in building affordable electric vehicles is a decrease in the cost of car batteries. Since 2008, the cost of an electric car battery has declined by 80%. Below is a chart that shows this dramatic decline:
The International Energy Agency has set a target of 12.9 million electric vehicles in major markets by 2020 and 100 million on the road by 2040.
According to Bloomberg’s New Energy Finance group, by 2025, over 5 million electric vehicles will be sold each year. This is a giant 887% increase over 2016’s level. Below is a chart that shows the Katusa Research electric vehicle annual sales forecast.
The seismic shift from gasoline-powered cars to electric vehicles is a generational change. Despite GM’s early win with the Bolt, Elon Musk and Tesla remain the poster children of EVs.
The U.S. electric car company Tesla is now comparable by market capitalization to GM and Ford… while selling a fraction of the number of cars of GM or Ford. Tesla achieved this feat despite selling a lot less vehicles than the old heavyweights.
The Safe, Sure Route to EV Profits
Over the coming years, people will bet big on who will win the great EV race. Will it be Elon Musk and Tesla? Will it be GM? Nissan? Will it be an upstart we haven’t heard of yet?
Picking technology winners is a very tough game. It’s a constantly changing landscape. Technological innovation is accelerating at an incredible pace. Today’s dominant force is tomorrow’s loser.
Rather than bet on car companies, I’d much rather take the safe, sure route… and simply sell every EV maker a material it must consume in huge quantities for decades in the future. I’d rather sell them copper. Demand for this critical EV ingredient is set to boom.
Copper 101
Copper is a vital element used in nearly everything around you. It’s used for plumbing in houses and factories. Since copper is also a wonderful conductor of electricity, it is used in power lines, electric motors, wiring, cars, and appliances.
This aspect – copper’s excellent electrical conductivity – makes it a critical part of the EV revolution.
Electric vehicles require three times more copper than conventional international combustion engine vehicles. On average, a car with an internal combustion engine uses 55 pounds of copper. A hybrid uses about 110 pounds, and an EV uses 165 pounds of copper.
Some basic math shows that the coming electric car boom will create a super boom in copper demand.
In 2016, the world consumed 50 billion pounds of copper. Keep this number – 50 billion – in mind. We’ll come back to it later.
In 2016, 158,614 EVs were sold in the U.S. EVs made up 1.6% of the total U.S. car market.
It is expected that by 2021, EVs will make up 4% of total U.S. vehicle sales. The consensus from independent analysts, including the brain trust at Bloomberg, is that by 2030, the adoption of EVs in the U.S. will be 34%.
What does that mean for copper demand?
First, we have to make some assumptions to calculate the net effect on copper demand.
Let’s assume a conservative adoption rate by 2030 is just 20%, not the accepted 34%.
An EV adoption rate of 20% means there would be 3.6 million EVs sold in the U.S. in 2030.
Let’s assume EV technology becomes much more efficient and the amount of copper needed per car decreases from 165 pounds to 100 pounds by 2030. Using these assumptions, we find that conservatively, the U.S. automobile sector alone will consume 1.1 billion pounds of copper in 2030. The EV sector will consume 360 million pounds of that total (33%).
That is a lot of copper. Just the new EVs, using my conservative metric, will increase U.S. annual copper consumption by just under 9%.
Now let’s look at China.
China is the world’s largest vehicle market. In 2016, 282,000 EVs were sold in China, 77% more than the number sold in the U.S. This is where the numbers get mind-boggling.
In 2016, 28 million vehicles were sold in China. EVs were just 1% of the Chinese market.
The Chinese government is planning for 4% EV adoption by 2021, which would mean 1.12 million EVs will be sold in China in less than five years.
Again, using our conservative estimate of 100 pounds of copper per EV, in 2021 China’s EV market will consume 112 million pounds of copper, on top of the 1.35 billion the rest of the Chinese vehicle market will consume.
The Chinese government plans on mandating specific quotas of EVs its automakers must follow.
China has stated it wants 7 million EVs (or 20% of its 35 million vehicle market) sold by 2025. This is very aggressive; a more conservative number would be 7 million by 2030. That means the total consumption of copper in the Chinese vehicle market will be 2.1 billion pounds, of which 700 million pounds will be just EVs.
With EVs in the U.S. consuming an additional 360 million pounds of copper over current demand and EVs in China consuming an additional 700 million pounds of copper over current demand, we get 1.06 billion pounds per year in extra demand. In a 50-billion-pound annual market, that’s a 2.1% increase in demand.
While 2.1% may not sound like a lot, let’s put it into perspective. An annual demand increase of 1.06 billion pounds is more copper than Rio Tinto produced in 2016. Rio Tinto is the 9th largest copper producer in the world. To put it another way, there are only four copper mines in the world that produce more than 1.06 billion pounds of copper on an annual basis.
I think you get the picture with just the U.S. and China. The rest of the world will follow.
Several pages ago, we showed you our EV sales forecast through 2025. You’ll recall that we project incredible growth from today to 2025. Looking further into the future, some are even more bullish on EV growth.
The chart below published by Bloomberg New Energy Finance shows that by 2040, the global EV market could get to over 60 million vehicles sold that year alone.

I underestimated the use of copper in EVs on purpose.
The fact is, scientifically speaking, for the EVs to become even more efficient, they would use more copper per vehicle, not less. That’s an interesting topic for another day, but it comes down to efficiency. Aluminum cannot replace copper in EVs for many reasons.
What I didn’t mention yet is the amount of “plug in” infrastructure that will be required to meet EV demand. All those EVs need special charging stations. China is heavily investing in new electricity grids; the U.S., under President Trump, plans major infrastructure projects that will all create new demand for copper.
And green energy uses multiple times the amount of copper per unit of energy compared to that of coal and natural gas.
Another major new source of demand for copper will be the Smart Home. Smart Homes use over twice as much copper as traditional homes. Installing solar roofs and all the other features that include the electrification of a smart home will double the use of copper in a house.
Combine the growth from EVs and other sources of demand with copper’s existing 3.34% historical average annual demand growth, and there could be a scenario in which the growth rate of annual global copper consumption reaches more than 3.5% over the next 25 years.
While this might not seem like much, it’s actually enormous demand growth for a mature market. It translates into a 136% increase in global demand over the next 25 years.
The World Needs a Lot of Copper, but It Won’t Get It for $3 Per Pound
If we believe annual copper demand is set to double over the next 25 years, the next question we have to ask is, “Can the copper mining industry supply that much?”
The answer is “Yes, but not with copper at $3 per pound.”
We’ll get into the data below, but in preview, the world’s largest, most important copper mines – the ones that set the global copper price – are in decline. They have been in operation for decades, and their richest parts have been tapped. To use an analogy, most of the world’s big copper mines are like former all-star ball players in their late 30s and early 40s. They were great in their prime, but their ability to produce is steadily decreasing.
Existing mines still have plenty of copper ore, but it is less plentiful and it’s of lower quality (lower grade). In other words, it will cost more to mine each pound of copper mined in the future.
There are also some large undeveloped copper deposits in the world that can and will be put into production, but the shovels won’t start digging unless copper is substantially higher than current levels.
Surging demand. Limited supply. It’s a recipe for higher prices. Here are the details.
Ore Grades Are Declining
Currently, 178 producing copper mines supply 83% of the world’s copper. The remaining 17% of mined copper comes from secondary production where the main metal produced is not copper.
More than half of this mine production – 68% – occurs in mining-friendly or relatively mining-friendly countries. I often call these countries “non AK-47 countries.” In these places you normally don’t see random people walking around cities with AK-47 machine guns. I count the U.S., Canada, Australia, all of Europe, Chile, Peru, and Brazil in this group.
About 32% of copper mine production occurs in AK-47 countries. These are places where it isn’t uncommon to see people walking around with AK-47s. The countries are known for not having great respect for contracts and property rights (and often human rights). They are not the kinds of places I’d take my family for a vacation. In my book, copper-producing AK-47 parts of the world are Russia, Congo, Iran, Mongolia, Saudi Arabia, and Kazakhstan.
One of the best measures of a mine’s quality and potential profitability is a metric called “ore grade.” It measures how much metal a miner gets for every tonne of rock and dirt it digs up. The lower a mine’s grade, the more digging and processing its operator must do to producer copper. This results in higher costs.
The chart below shows the average annual reserve grade of the world’s global copper producers. This group is made up of large miners you’ve likely heard of. Companies like BHP Billiton, Freeport-McMoRan, Antofagasta and First Quantum. As you can see, the average grade has declined 60% over the last 14 years. It’s an irreversible trend.
Increasing Production Costs
Declining grades are pushing production costs higher and higher. Below is a chart that shows the cash costs of production for the same group of global copper producers.
A Lack of Big Discoveries
In addition to falling grades and rising costs, the copper industry simply isn’t finding as many large new deposits as it used to. Mankind has been digging into the earth in the search for copper for thousands of years. We’ve found most of the really good stuff. Over the last 10 years, over $300 billion dollars has been invested globally in the exploration, development, and production of copper. And only a handful of new mines have been put into production.
The chart below shows how large copper discoveries have declined over the past 25 years.
Governments and Poor Infrastructure Constrict Supply Growth
In addition to the challenges above, the copper industry faces huge challenges from governments and poor infrastructure. These two factors often work hand in glove to increase production costs and slow down or stop new projects.
Operating a big open pit copper mine requires enormous amounts of electricity. It powers electric shovels and trucks. It powers the mills that crush the rock. It powers lights. Depending on the operation, electricity can be anywhere from 15-30% of the cost per pound of copper produced.
During the downturn of the last few years, electrical grids in many parts of the world that have advanced promising copper deposits (that should be soon in production) have not increased electrical capacity that can meet the demand from the copper mines. A general rule of thumb is for 100 million pounds of open pit copper, a mine needs 65 MW of electrical capacity (an enormous amount of electricity). This capacity requirement is equivalent to 65,000 homes needing electricity.
As the project gets bigger, the ratio improves by 15% for every 100 Million pounds.
Many of the expected large copper projects that the market expects will come online shortly in Africa cannot tap into the existing electricity grid because there is simply no excess electrical capacity.
As a result, the potential copper mine will have to make up for the lack of electricity from the grid with their own, higher-cost sources of electricity, whether by installing diesel generators or by building their own power plants. In other words, the price of copper under $4 per pound doesn’t justify the infrastructure capex.
Also, expect certain countries in the third world to use access to the existing electrical grid as another piece of leverage for a piece of the profits at higher copper prices.
For example, large copper producer First Quantum Metals was recently told by the Zambian government that the amount of electricity that is supplied to their copper operations will be reduced.
The Zambian government is using electricity as leverage for a bigger piece of the project’s profits. But at the end of the day, this will result in a higher cost of production, because now the company will either have to pay higher prices for electricity or install supplemental power sources at a much higher cost.
Another example of a government making life difficult for miners is the Freeport McMoRan/Indonesia story. Freeport is one of the world’s largest, most powerful miners. Its Grasberg operation in Indonesia is one of the world’s most productive mines. In 2017, Freeport was forced by the Indonesian government to reduce its stake in the operation from 91% to 49%. This was a huge setback for one of the world’s biggest miners. Freeport invested $12 billion into Grasberg to own 91% of it. Now it only owns 49%. To make things worse, Indonesia stated that if Freeport doesn’t invest another $10 billion within 10 years, it will lose its remaining 49% interest.
You can argue all you want about what is right and wrong when it comes to a government appropriating assets, but the result is still the same. When governments seize assets, it drives up costs.
Where Recycling Comes In
Copper is recyclable. Generally, it is not burned up like oil or natural gas. When analyzing the copper market, you must always factor in recycling.
I believe recycling will meet some of copper’s future demand, but even at $4.50 per pound, recycling met less than 20% of the demand. Recycling copper is a high-cost solution. Also, there are new restrictions on recycling copper in China that will also increase the cost of recycling. There will be no flood of recycled copper to halt a sustained rise from the current price around $3 per pound to over $4 per pound.
Summing Up the Supply Situation
At Katusa Research, we expect annual global copper demand increases to rise from 3.34% to 3.5% in 10 years, to 3.75% in 20 years, and as high as 4 % in 25 years. For reference, the world’s largest copper mine, Escondida in Chile, produces 2.18 billion pounds annually. We need to add the equivalent of Escondida’s annual production every 2 to 3 years.
Even if we assume no growth in global copper demand, the world will run out of copper in 22 years by only mining the known reserves of all the mines in production today.
Yes, that math is correct. I double-checked it myself. It’s clear just on that basis alone, new mines will have to come into production to replace the depleted mines. But thanks to ore grades falling at major mines and a lack of large new discoveries, the copper industry cannot meet that demand with copper at $3 per pound. The price must increase to at least $4 – and probably to $5 to spur new production.
And keep in mind, getting large amounts of new copper to the market isn’t like flipping on a light switch. Between permitting, construction, and dealing with all the red tape involved, getting a large copper discovery into production can take more than a decade. This means copper prices could run higher and stay higher for a long, long time.
Our Copper Strategy: Buy the World’s Best Projects That Aren’t Owned by Majors
In a strong copper price environment, investors can buy almost any copper stock and do well. The old saying here is “In a bull market, even turkeys can fly.”
However, by focusing on truly world-class projects in mining-friendly and politically stable jurisdictions that are not owned by majors, we get the best balance of safety and upside.
I can’t emphasize “mining-friendly” and “politically stable” jurisdictions enough. I can’t emphasize my AK-47 Indicator enough. It’s critical to keep our investment dollars away from dictators, communists, and power-mad lunatics.
Do you think the producing or undeveloped projects in Congo, Russia, and Iran are safe? Ask Freeport where it wants to build its next mine. I can assure you it won’t be in an AK-47 nation. Freeport had enough money to hire the toughest, best lawyers and negotiators in the world. It got crushed by the Indonesian government. Lawyers and contracts are no match for guns and tanks.
It’s hard enough to make money in resources. Don’t make it 10 times harder by trying to do business in places where murder and theft are daily occurrences in business and government. Coming out ahead in a negotiation won’t do you any good if goons are waiting outside to shoot you.
Majors such as Freeport will look to develop world-class copper mines in politically stable jurisdictions.
The good news is we don’t have to sort through dozens of large deposits in non-AK-47 countries for potential investments. This elite list has only a few members. We’ve covered them before, but it’s well worth discussing the latest developments at and our current thinking on Nevsun, which owns the huge Timok project in Serbia and Northern Dynasty, which owns the super huge Pebble deposit in Alaska.
Nevsun Resources: A Potentially Big Tax Loss Selling Opportunity
I first recommended Nevsun Resources in our June 2017 edition. For my initial write up on the company,
click here.
Nevsun has two projects: the world-class Timok project in Serbia and a mid-tier producing zinc mine in Eritrea.
I recently bought my first tranche of Nevsun Resources at prices between CAD$2.58 and CAD$2.70 per share. I’m taking a slow approach to accumulating shares of Nevsun. I think the stock will continue to drift lower over the next four months, and I plan on increasing my position slowly over that time period. Please use this strategy as well.
I recently sat down with the CEO of Nevsun, Peter Kukielski, and the Chief Development Officer (CDO), Scott Treblicock. Scott has been with the company for a number of years, but Peter is new to the team. Peter replaced Cliff Davis, who retired earlier this year. Peter has been in the resource sector for three decades, working for large international base metal companies like ArcelorMittal. He is very smart and well connected, but he hasn’t run a mid tier like Nevsun before.
I think the market will need to warm up to Peter’s style, and that is our opportunity.
A big reason why I believe Nevsun shares will remain under pressure is because of the lack of significant news flow coming from the company. The only big news due out for the rest of the year is a revised Preliminary Economic Assessment (PEA) on Timok.
Any incredible drill results from Timok will further prove what most already know – this is a very large high-grade project that will continue to grow.
Timok already has a PEA, so the chances of Nevsun shocking the world with this revised PEA is slim.
Nevsun just went through a big management change. The new management team cut the mine life of Bisha, the operating mine in Eritrea, in half, and we sent out an update.
The other major reason I believe Nevsun will be under pressure until year end is because of tax loss selling pressure. In comparison to the rest of the base metals sector, Nevsun has been a significant underperformer. On a year to date basis, Nevsun is down 35%, while copper is up 19% and zinc is up 21%. Due to this significant under performance, I believe Nevsun will be a strong candidate for tax loss selling this fall. Using tax loss selling is a great tool for buying cheap shares in good companies.
Essentially, the way tax loss selling works is by selling an investment which is unprofitable. These losses go against other realized gains in the portfolio. This can offset part or all of the capital gains tax you need to pay for the year. Then at the beginning of the following year, you re-buy the stock which was your big loser for the year.
Below is a chart that shows how Nevsun has performed in comparison to its base metal peer group.
Based on our simple tax loss selling strategy, I believe many Nevsun shareholders will sell their position at a loss soon and use this loss to offset other gains made elsewhere in the base metal markets. I plan on using the lack of news and tax loss selling to my advantage to build a large position in the company.
I’ll continue to wait patiently and accumulate stock.
How low can Nevsun go?
The base metal markets have performed extremely well over the past few months. Zinc is near a 10-year high at $1.40 per pound. Copper is back above $3 for the first time since 2014. This is important because Nevsun is not operating in a weak commodity price environment. This should provide a bit more of a backbone to the share price. If copper was back down to $2.25 and zinc was at $1 per pound, Nevsun shares would likely be in a tailspin.
That said, I believe Nevsun has not yet hit bottom. I believe the low will be between now and Q1/18, because that is when the pre-feasibility study will be out on Timok. Furthermore, Nevsun’s operating mine is a zinc producer. It should be a cash flow machine at current prices. This uplift in cash flow from current zinc prices will show up in the end of year financial statements, which come out in the first quarter of 2018.
Below is a chart of Nevusn’s share price since 2001. This gives us a good sense of how range bound the stock has been over the past few years. You will also see four green horizontal lines on the graph. These are the support points from a technical trading perspective. When you buy stock in tranches, you want to try to accumulate stock near support points like you see at the green lines.
Since 2010, the CAD$2.75 share price has been a support point. Nevsun briefly broke below that this past month. I believe given the minimal news flow and promotion, Nevsun will continue to trade between $2 and $3 per share. I realize this is a wide range, but the commodity markets are extremely volatile right now. Being cautious is never a bad thing.
Everyone should channel their inner alligator and begin to stalk Nevsun. I will personally be looking to add to my position as the company moves lower. Below is the strategy I plan on using for my purchases of Nevsun.
Northern Dynasty: Time to Buy Again
I’ve received more questions about Northern Dynasty than any other stock in my career (TREK is the 2nd most, and I will get to Trek later in my letter).
For new subscribers, back in July 2016, I recommended subscribers buy shares in Northern Dynasty Minerals under CAD$0.45 per share. It was one of our first recommendations.
Northern Dynasty is a company that I have spent literally hundreds of hours researching. It owns 100% of the world’s largest undeveloped copper gold project, called Pebble.
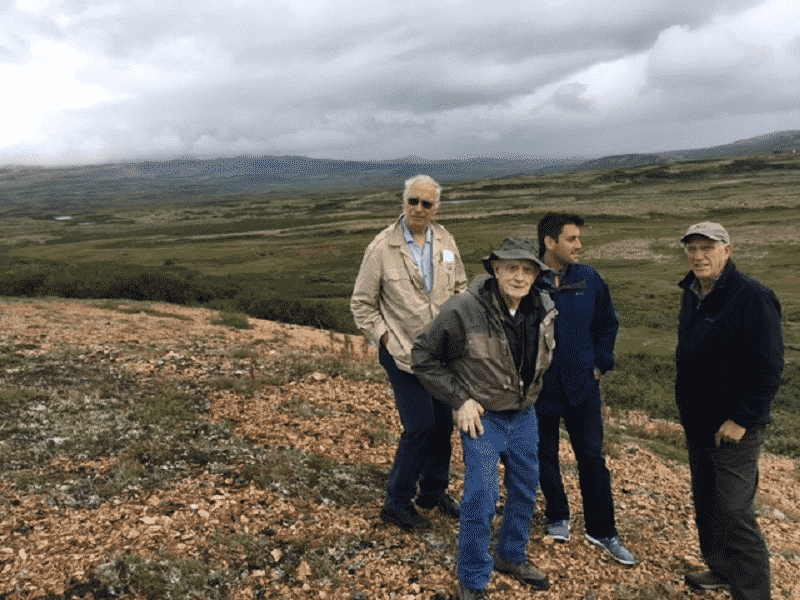
I flew up to the project with company chairman Robert Dickinson, CEO Ron Thiessen, Doug Casey, and legendary geologist David Lowell to see the deposit first hand. It showed me once again the importance of site visits. Before I visited the site, I thought I knew everything about the Pebble deposit. Upon arriving, I realized that I didn’t truly understand or comprehend the massive size and district scale potential of the project.
From left to right: Doug Casey, David Lowell, Marin Katusa and Robert Dickinson
I’m truly blown away by Pebble’s size and potential.
Northern Dynasty has been a huge win for myself and early Katusa Research Opportunities subscribers.
For those new to Katusa Research, the chart below is a share price chart of Northern Dynasty from January 2016 to present. I will outline my previous investment thesis, the short selling report which came out on the company in February 2017, and my view on the company moving forward.
A Quick Backstory on Northern Dynasty
Northern Dynasty’s asset, called Pebble, hosts over 100 million ounces of gold, over 80 billion pounds of copper, over 500 million ounces of silver, and a lot of rhenium. It’s a true giant.
The cost to build this potential mine has always been a big question surrounding this project.
On February 14
th, 2017, a New York-based short selling fund issued a short report on Northern Dynasty. This short selling fund took a position, then issued a report to the public. I won’t get into the nitty gritty of it all or the fund managers driving arrest under the influence and found by police with cocaine in this report, but you can read my analysis and rebuttal to the short report
right here.
In the end, the short sellers capitalized on the market sentiment and the result of two newsletters being stopped out of the stock. As a result, the stock fell over 60% in the span of a few days.
I suspect the initial short group have covered their positions. They haven’t published anything on Northern Dynasty in months, and that usually means they have covered and moved on to another short attack. However, Northern Dynasty has attracted many other short groups, and the stock remains a heavily shorted stock.
So we know the stock is heavily shorted. We also know that the company has publicly stated that a Joint Venture partner will be confirmed by year end.
The question the street asks is – what will the groups shorting Northern Dynasty do if/when Northern Dynasty announces they have brought in a company as a Joint Venture partner?
I think initially, the short sellers will continue to short the shares and try to dismiss the merits of the Joint Venture, but ultimately the answer to the question depends on what the Joint Venture deal looks like.
I have personally been involved in Joint Venture discussions on a board I sat on which eventually brought in a Joint Venture partner and is Canada’s third largest copper producing copper mine. I have pretty good understanding of the different structures that can be involved.
What would be my ideal Joint Venture structure as a big shareholder of Northern Dynasty?
First off, Northern Dynasty owns 100% of the Pebble deposit. To understand what the next Joint Venture deal would look like, we have to understand the previous Joint Venture deal on Pebble between Anglo and Northern Dynasty.
In 2011, Northern Dynasty was one of the hottest stories on the street. It had a market capitalization of over $2 billion. Anglo American, one of the world’s largest gold producers, signed on to partner with Northern Dynasty. The terms of the deal stated essentially that Anglo had to not just spend money to submit a permit, but spend $1.5 billion towards construction to earn its 50% of Pebble.
Things got ugly for Northern Dynasty in 2013 when the Environmental Protection Agency (EPA) used the 1972 Clean Water Act (specifically Section 404(c) to halt progress at Pebble. The EPA made a handful of ridiculous assumptions, including using its own mine plan instead of Northern Dynasty’s mine plan. The result was a work stoppage. A long legal battle followed. Over the following three years, Northern Dynasty’s share price plummeted. JV partner Anglo American jumped ship. At one point, large Northern Dynasty shareholder, Rio Tinto even donated the Northern Dynasty shares it owned to a charity. It was a disaster. However, at some point even the most tarnished, most hated become valuable. This is when I started spending days on end (eight months in total) researching the company.
Anglo walked away from Pebble, owning nothing of the project, after $750 million was sunk into the project. I estimate it will cost somewhere around $150 million to get the project to submission for a mining permit.
I think the ideal next Joint Venture partner will basically pick up where Anglo left off.
A Joint Venture partner will have to pay all costs upfront to submit for a mining permit and will have to spend anywhere from $1 billion to $1.5 billion to earn 50% of Pebble.
If Northern Dynasty can pull off anything like what I mention above – wow – the short sellers will have the sense to cover and move onto another short attack. They would be insane not too.
All the short sellers would have left would be to stick around for another 2-3 years and speculate the status of the mining permit. That isn’t what the short attack groups look for.
But if Northern Dynasty isn’t able to attract a Joint Venture partner, the shorts will take this stock lower.
I believe Pebble is so extraordinary that a Joint Venture on the terms I stated above will happen.
My bet on Northern Dynasty was based on several factors.
Firstly, I believed the EPA had overstepped its fiduciary duties and that the Clean Water Act violation would eventually be retracted. This would allow Northern Dynasty a legitimate shot at permitting. I was right, and the 404(c) veto has been lifted.
I also stated that if the 404(c) veto was lifted, the quality of the project will attract a Joint Venture partner.
I am very bullish copper moving forward, and there are few projects that are not owned by a major that are better than Pebble, which is 100% owned by Northern Dynasty.
We have a database of thousands of projects, and the list below is what I would call world-class development-stage copper assets with over 20 billion pounds of copper, that are not owned by a senior mining company.
When I put together the list of world-class gold assets above 20 million ounces not owned by a major, we find that Pebble is again on the top of the list.
Pebble’s total reserves and resources would be a huge boost to a senior gold producer’s reserves and resources. The Pebble deposit is nearly equal to all of giant gold miner Goldcorp’s worldwide gold reserves and resources.
At first glance, you may think that the Pebble’s gold grade is too low. The Pebble deposit is a copper/gold porphyry deposit, and about 68% of the value of the cash flow is from copper. And as you can see, the copper grade is at the average of the senior peer group.
Pebble is one of the best undeveloped copper-gold assets in the world. If we did the same for silver and rhenium, Pebble would show up on both of those tables as well.
Catalysts Moving Forward
On May 12th, 2017, the EPA retracted from the dispute and settled with Northern Dynasty.
Under the terms of the settlement agreement, the EPA has agreed the Pebble project can proceed with normal course permitting. This settlement was a huge milestone for Northern Dynasty and allows it a fair shot at getting environmental approval for the mine.
When a company wants to build a mine, regardless of location within the United States, a company must complete an Environmental Impact Statement (EIS). This is conducted by a third-party group called the U.S. Army Corp of Engineers. Northern Dynasty will provide the U.S. Army Corp of Engineers with its potential mine plan. The U.S. Army Corp will assess the mine plan and conduct its own due diligence. Based on its findings of the environmental impact of building the mine, the U.S. Army Corp will either pass or fail the project.
Northern Dynasty is now in an interesting spot from a valuation and trading perspective. If you are not comfortable with short-term trading, stop reading and do not buy any stock in Northern Dynasty. If you are a nimble trader, read on.
With the EPA out of the way, Northern Dynasty has the normal course permitting process which it did not have due to the 404(c) veto.
Getting a Joint Venture partner to fund the work required to enter the permitting process would be a huge win for the company.
The permitting process will take a long time. Building a mine the size of Pebble will take even longer. It will take at least 24-36 months for the Joint Venture to complete the work required and start the permitting process.
It has been well publicized that Northern Dynasty is seeking a new Joint Venture partner for the project. Northern Dynasty CEO Ron Thiessen hopes to have a partner by the end of the year.
If Northern Dynasty signs on a Joint Venture partner, I believe this will be a very positive catalyst for the share price, depending on the terms of the JV.
Once again, I don’t know when this will happen, but I suspect it will happen within the next 6 months.
Another positive catalyst for Northern Dynasty is the copper price. As I write, the price of copper is $3.10 per pound. Copper is up 21% year to date and 38% since I recommended Northern Dynasty in July 2016. Remember, Pebble has 80 billion pounds of copper reserves and resources. Pebble’s value is incredibly leveraged to the price of copper.
I believe the copper rally is sustainable and prices should remain above $3 for years to come, subject to a major global recession.
Both of the above catalysts should mean that eventually the short sellers will cover their stock, fueling more buying. Remember, when you cover a short, you need to buy back the stock you’ve sold.
Northern Dynasty shares have remained range bound for the past few weeks, trading between CAD$1.70 and CAD$2.25 per share. I believe there is an excellent arbitrage here based on the catalysts listed above. I think nimble traders can accumulate a position under CAD$2.25 and sell 50% of the position into positive news catalysts above CAD$3 per share upon a major announcement of a large miner farming into the project.
Again, if you do not have a position in Northern Dynasty, I believe the next six months will give you another great profit opportunity in the stock. You can accumulate shares near these levels and look to take quick profits in 6 months, upon the JV announcement creating a pop higher in the share price.
New Portfolio Recommendation:
Liberty Gold: Can We Get a Gold Portfolio Free?
Of the hundreds of features a natural resource business can have, two of my favorite are: a) Managed by exceptional people who own large amounts of stock (aka “skin in the game”), and b) Operating in a proven area that was productive in the past but hasn’t been explored, developed, or produced using the latest technology.
Regular readers are familiar with my emphasis on people. It’s the most important aspect of my analytical process. We want to back smart, honest, serially successful people. Yes, it’s an obvious thing, but many investors don’t place enough focus on it. It ends up costing them lots of money.
Less obvious is the lucrative strategy of buying proven assets that were productive in the past, but for various reasons have been shuttered or are operating at a fraction of their potential. Exploration technology has changed so much over the past 25 years that we’re finding many abandoned projects that have much, much more potential than “old timers” using what seems like Stone Age technology ever believed they had. By nature, abandoned or mothballed projects are very cheap. They can often be purchased for pennies on the dollar, explored with modern technology, and revealed to be worth 100 times the purchase price.
I bring these positive characteristics up because my team and I have performed a lot of work to understand and value a stock with plenty of both. Its name is Liberty Gold.
Liberty Gold is a CAD$65 million market cap junior gold company with assets in the U.S. and Turkey. It began trading under its current name and ticker in May of this year. Before that, it was Pilot Gold, a company formed and led by Mark O’Dea.
I have been watching this company (in its various forms) for years. And now is the time to start building a speculative position. I believe we have a good shot of getting Liberty’s promising portfolio of U.S. gold projects for free. The catch? The company must sell its assets in Turkey.
Below, I cover the people involved in the deal and explain why this speculation is so compelling.
OPEN Disclosure: I will be purchasing stock under CAD$0.45 in the open market. I have purchased stock at CAD$0.43 before our site visit to all three U.S. properties. We have removed our bid to buy stock upon decision of writing up the company to be fair to all subscribers (we put internal restrictions on buying or selling any shares once we decide we are going to initiate coverage on a company). We will start putting in our bids under CAD$0.45 two business days after our write-up. As always, when we decide to sell, subscribers will get first notice and exit.
Please review my strategy on both buying and selling later in the report.
Management Team
Mark O’Dea – Chairman: He was the founder and CEO of Fronteer Gold, which was acquired by Newmont in 2011 for $2.3 billion. Additionally, Mark was the Chairman of True Gold, which was acquired by Endeavour Mining in 2015 for CAD$240 million. In 2010, Mark sold Aurora Energy, also a company he founded, to Paladin Energy for CAD$260 million.
Cal Everett – President, CEO & Director: The destiny of this company changed on February 22, 2016. Cal Everett joined the company as President and CEO. The moment I saw the press release hit the wires, I phoned Cal, who I have known for over a decade. The first meeting Cal Everett had as President and CEO of Liberty Gold was in my office, his first day as President and CEO.
Cal Everett was one of the most powerful investment bankers in the business. I was surprised when I saw him join a public company. Cal is a straight-shooting geologist with business sense – which is very rare in our field.
Cal is an industry veteran. He is the former President & CEO of Axemen Resource Capital. He comes from the natural resource investment banking side of the industry with expertise in economic geology. Cal is aggressive and is driven to create shareholder value. Ironically, before Cal joined Liberty Gold, he was trying to bid for some of the U.S. assets with another group. When Mark O’Dea outbid Cal, Mark offered Cal the position as President and CEO.
Moira Smith – VP Exploration: Few geologists can claim they have been a part of a world-class mine discovery. Moira has run the exploration programs for four different mines which are now in operation. Moira ran the exploration program for Fronteer Gold, which discovered the multi-million-ounce Long Canyon gold deposit. Long Canyon is now one of Newmont’s flag ship producing gold mines. Previous to Fronteer, Moira ran the exploration program for Teck Resources’ Pogo and Petaquilla projects, and Torex Gold’s El Limon project. All four of these mines are currently in operation today.
Portfolio:
I will explain why I waited so many years before I decided to buy Liberty Gold. I believed the company wasn’t going to be able to develop its Turkish assets, and would eventually have to sell them. Years ago, I spent time in Turkey looking at another resource development opportunity. I found it very hard to economically develop the assets there at the time because of the royalty and tax structure of the country for producing assets owned by foreigners.
But the assets Liberty Gold owns are mid-tier quality assets that I believe will be sold in the current market environment to a Turkish company. The big question is, what is the Turkish portfolio worth?
Liberty Gold has a pair of development stage assets in Turkey. These assets are in a joint venture with Teck Resources. Teck Resources is a $13 billion diversified mining company with assets all over the world. Both assets in Turkey were discovered by Liberty Gold’s parent company Fronteer Resources. Fronteer was acquired by Newmont, and these assets were spun out prior to the conclusion of the sale and used to create a new company, at the time called Pilot Gold.
Halilaga is the most advanced Turkish asset, with a Preliminary Economic Assessment which yields a Net Present Value of $474 million and a quick payback on initial capital of 1.3 years.
So after applying a steep discount, what are the Turkish assets worth?
The current after-tax NPV using a 7% discount of Halilaga using $2.90 copper and $1,200 gold was $474 million. Liberty Gold owns 40% of the project. The peer group of development assets like Halilaga trade at about 60% of their NPV.
We applied a further discount of 35% to the peer group average of 60% of the NPV value to account for jurisdictional risks, since the assets are in Turkey. We then applied another discount of 45% to that overall number for tax risks and other unforeseen risks. We have taken an overall discount of 78.55% of the NPV value of the asset, which already has been applied a 7% discount after tax. I think everyone can agree we are being very conservative in our valuation.
To be even more conservative, we have applied even harsher discounts to the other asset in Turkey, TV Tower. We have given zero value for the copper associated to the resource, and only $10 per ounce in ground for the 43-101 measured gold resource. The peer group of TV Tower trades between $15-25 per ounce in the ground. The table below is the excel spreadsheet of the values above to show our calculations.
The conclusion is impressive. Even after applying our very harsh discounts, the fire sale value of Liberty Gold is worth the entire enterprise value of the company. In other words, buying stock at these levels gets you the complete U.S. portfolio for free (more on this portfolio in a moment).
What’s the catch?
Liberty’s JV partner in the Turkish assets, Teck Resources, is in no rush to sell. Remember, it is a multi-billion-dollar company. This means a couple things:
1) Nothing ever moves quickly at Teck, and
2) Teck is not desperate for cash.
It means that there won’t be a rush to sell the assets. It will take longer than everyone expects. That said, I do expect Liberty Gold to monetize these assets. I believe Liberty will monetize their Turkish assets within 24 months. And this is a big part of our thesis.
Liberty’s U.S. Portfolio
Liberty’s flagship project is the Goldstrike project, which is on the border of Nevada and Utah. From 1988 to 1994, Goldstrike produced slightly over 200,000 ounces in total of gold at an average grade of 1.2 grams per ton.
Back in the early 1990s, the average price of gold was around $350 per ounce. A low gold price limits a miner’s ability to mine deeper pits or mine lower grade ore. What is crucial to understand about the Goldstrike’s previous operators is that they only targeted high-grade surface gold. Gold was only $350 per ounce, so there was no exploration and the operation was on strict grade control in order for the operation to stay afloat. Additionally, technological innovations that we take for granted today (like 3-D modelling) didn’t exist 20 years ago. The deepest portion of the historical pits at Goldstrike is 100 meters (300 feet). However, mineralization does not stop there. The average open pit these days is upwards of 300 meters (900 feet) deep, and you can go as deep as 600 (1,800 feet) meters.
Again, some of my favourite resource projects to invest in are those that have had significant work and production in the past but have never seen modern technology to advance and modernize the project. There is a lot of low hanging fruit on this project that will be modernized. I believe it will unlock a huge amount of value in the company.
The picture below shows several of the old pits in the background with a Liberty Gold drill rig testing mineralization at depth in between several of the old producing pits.
Pete Shabestari is the Project Manager at Goldstrike. He is extremely smart and has been in the industry for a long time. He is part of the original Fronteer Gold crew which delineated the Long Canyon deposit, which was bought out by Newmont for over $1B in 2011. Additionally, he’s worked for BHP, Anglo Gold, and Kinross, so he understands how the big boys think. I spent an hour at Pete’s house in Utah where he, Liberty Gold VP of Exploration Moira Smith, and I discussed the plans for Goldstrike. Pete plans to aggressively drill the zones between the deposits. The theory is the mineralization will be extended significantly.
Pete and his team will try to prove this through the drill program. We have been on hundreds of site visits and Pete and his team are about as good as we have when it comes to organizing data to create a geological model. This is important because the more accurate the geological model is, the more efficient and the more likely the drilling program will achieve success.
Getting the geological model right is important because drilling is expensive. If the drilling can prove the model, the higher return on drilling dollars (RODD) will be, and more gold will be found. A high RODD indicates an efficient successful resource delineation. A low RODD would be indicative of a management team wasting money or not correctly interpreting the deposit. The RODD is a crucial metric that I have developed over the years.
Liberty Gold CEO Cal Everett and his team have been extremely active with the drill rig over the past 12 months. Through this aggressive drill program, Liberty has delineated a potential main zone at Goldstrike which is 4km2 (1.5mi2). Within this zone, there are eight historical producing pits. These older pits represent the most likely areas for additional gold mineralization. I believe this is low hanging fruit. I believe further drilling will show that mineralization lies both below and between the past producing pits.
Below is a map which shows the main historical workings. I’ve outlined in yellow where the potential for three open pits could be in operation.
The map below shows the drilling activity and the delineation of the gold mineralization from a portion within the main zone.
Each black line represents a drill hole. Each colored block from lightest to darkest indicates the grade of gold mineralization in grams per ton in that particular section of the drill hole.
The Katusa Research database indicates the average resource grade for open pit gold mines in Nevada is 0.93 grams per ton. Past gold production at Goldstrike averaged above 1 gram per ton, and recent drill results indicate that gold mineralization should continue in the 0.8 to 0.9 gram per ton range.
I believe Liberty Gold will release a positive maiden resource estimate by mid-2018. Given what we can infer about the mineralized system, based on the strike length and average gold grade in the system, I think a maiden resource estimate in the range 1 to 1.1 million ounces at an average grade of 0.9 grams per ton is attainable. Given the region and its proximity to infrastructure, I believe this type of mine would be profitable at $1,200 gold.
Another Liberty asset is the Black Pine gold project, located near the Utah-Idaho border and a 2-hour drive from Salt Lake City. The Black Pine project produced 434,780 ounces in total of gold from 1992 to 1997. The average historical recovery rate was 75%. Just like at Goldstrike, the previous operators mined only the most lucrative and most accessible mineralization, leaving the majority of the deposit untested. Liberty Gold’s VP of Exploration, Moira Smith, has wanted this project for years. Finally, in the spring of 2017, Cal Everett acquired it at an incredibly cheap price of $1 million.
Shortly after Liberty Gold acquired the asset, Black Pine Project Manager Will Lepore found an old data file with assay results from over 1,300 drill holes on the project. The previous owners didn’t know about it. The previous owners didn’t understand what they owned, and they had no money to drill the project.
We spent a full day touring Black Pine with Will. We were very impressed with his knowledge of the project. Will worked both at Long Canyon and in Turkey for Fronteer Gold. The 1,300 historical drill holes he found would cost $10 million today to drill. Liberty Gold will use the data to create a geological model.
The map below shows the concentration of gold in soil, one of the primary initial exploration tools. The scale goes from blue to red, with red being the highest concentration of gold in soil. As you’ll see below, it outlines numerous targets, both within the existing pits but also in many other areas which are untested.
The areas labelled “pit” are historical producing pits. There is significant potential to join the C/D Pit and the E Pits together to form one new large open pit gold mine. The second-highest priority area is east of the A pit, labeled as the J and H Anomaly.
Liberty’s third exploration project in the U.S. is the Kinsley project, located in Nevada. Standing on a hill at the Kinsley project, we could see Newmont’s Long Canyon deposit that was discovered by the Liberty Gold management team.
Liberty Gold owns 79% of Kinsley. In the 1990s, Kinsley produced 138,000 ounces in total from six small heap leach operations. Liberty is joint-ventured with Nevada Sunrise, and the pair have delineated an initial resource estimate of 527,000 ounces at an average grade of 2 grams per ton. Kinsley shows potential to be a district scale operation with over 12km of prospective ground, 80% of which remains untested. The map below shows the current schematic of the resource estimate. The key to success at Kinsley will be to delineate additional shallow oxide gold. Oxide gold is the easiest form of gold to process because it is much cheaper to extract the gold from oxide rock than from sulphide rock.
Valuation
I think there is a 50% chance that Liberty Gold will be able to sell one or both of their Turkish assets within 6 months. I am 90% confident that Liberty will sell their Turkish assets within 24 months. Again, I believe these assets could be sold for a value equivalent to the entire market value of Liberty. We’d get the U.S. assets for free.
That is why I would like to have my first tranche purchased within the next 45 days.
If the company doesn’t sell the assets by year end, there will be significant tax loss selling pressure on the stock, and we will be able to buy our second tranche during tax loss season and/or participate in the financing the company will have to do by year end or early 2018 if it can’t sell at least one of the Turkish assets.
Liberty Gold has a solid balance sheet with CAD$10 million in cash and no debt, but that will be gone by late 2017/early 2018 due to the aggressive drill program.
The last financing in November 2016 was completed at CAD$0.65, a significant premium to today’s share price of CAD$0.43. I was offered a piece of the financing, but I passed on it because I expected the stock to fall on any commodity weakness and a delay in selling the Turkish assets. My hypothesis has proved correct, and at today’s share price, I believe Liberty Gold is undervalued.
The aggressive drill program at Goldstrike is an expensive undertaking. It costs close to $2 million per month. This means that by the end of the year, the company will need to raise money if there is no deal for the Turkish assets.
The prudent speculation here is as I stated above—to purchase ¼ of your desired allocation now (within 45 days) and try to buy under CAD$0.50. Then be patient and wait to buy another 25% of your desired allocation under CAD$0.45 during tax loss season.
Liberty is a relatively thinly traded stock, so it is critical that you remain patient and buy your position like a pro. DO NOT PAY A PENNY MORE THAN CAD$0.50. If you cannot buy like a pro and insist on getting impatient and buying like an amateur gambler, you have no business in this stock.
I repeat: Do not pay a penny more than CAD$0.50. Do not let market makers take advantage of you. It could take you weeks to accumulate your desired shares. That’s fine. It’s a common situation with professional investors.
Upon publication of this recommendation, there will likely be a surge in Liberty stock. Do not be bothered by this, and do not chase the stock. It’s very, very likely that any initial surge will be followed by a sharp decline. Don’t get caught up in the initial surge that “amateur hour” creates. Stay patient. Be one of the market’s alligators, not its prey.
Political Environment
Nevada is one of the world’s most mining-friendly jurisdictions. Over five million ounces of gold were produced in Nevada in 2016, which represented over 80% of U.S. gold production.
Turkey is home to many other gold miners, including Sandstorm Gold, Eldorado Gold, and Alamos Gold. The political situation there will cause a discount to the valuation of the projects, but we have discounted the projects significantly more than what we think the assets will sell for.
The Turkish Lira has depreciated significantly over the last few years versus the U.S. dollar. This provides operators with cheaper labour costs and helps the bottom line.
Company Catalysts
Cal and his team continue to pound the drill bit in Nevada. I believe the market is not giving the team enough credit, and the company is undervalued.
The first major catalyst for Liberty Gold will be selling the Turkish assets. Selling these assets would generate enough cash to fully fund the U.S. exploration program in 2018. This would minimize shareholder dilution.
The second major catalyst for Liberty Gold will come from additional drilling and putting together the initial resource estimate at Goldstrike. I want to see the team delineate at least 1 million ounces.
What I’m Doing
As I mentioned, I would like to buy at least my first tranche within the next 45 days.
This way, I have some more exposure to this exciting story if Liberty is able to sell the Turkish assets soon. If it is unable to sell them at a good price, it will likely do a financing. I’ll get my desired allocation and a great price in the financing.
If Liberty Gold can sell part or all of its Turkish portfolio, the company will not need to finance its U.S. exploration by going to the market for money. If this happens, the stock is an easy 50% gain from current prices. And we have a target price of CAD$0.68.
If Liberty cannot sell the Turkish assets, it will need to raise money by late 2017 or early 2018.
If Liberty Gold doesn’t sell its Turkish assets by year end, then the stock will stay sub CAD$0.50 until a financing occurs, regardless of exploration results from the U.S. portfolio, because the market knows the company will have to do a financing to continue drilling.
This stock is a very high-risk speculation. The last financing was at CAD$0.60 and this stock could be a tax loss candidate. The stock currently trades in the low CAD$0.40 range ($0.37-$0.43 per share over the last 30 days).
I want to buy stock under CAD$0.45. I also recognize that this is a very risky, very thinly traded stock that is not for everyone. Again, I want to add to my position under CAD$0.45, but recognize the gold market is starting to heat up again.
Buy your first 25% desired allocation Under CAD$0.50.
Then be patient and look to buy your second 25% desired allocation Under CAD$0.45.
But, my fear is that a few dozen large orders could take the stock to CAD$0.50, and then I will have many subscribers angry that they followed the guidance and didn’t get filled. However, I believe patience will be rewarded.
Final Thoughts
I find site visits important because you get to see how much the people on site know about the project, and how the project’s exploration dollars are being utilized. You also really get a feel for how a company operates. Perhaps the biggest takeaway from our site visit was the professional attitude the entire Liberty team takes.
From the CEO all the way to the bottom rung geologist, this team does not cut corners. Unlike most exploration companies, Quality Assurance and Quality Control is part of Liberty’s core philosophy. This team approaches its exploration and resource delineation work like it is going to build and operate any mine it finds, and it makes sense why Moira and the team have had such success in the past. The goal is not to just rapidly delineate ounces, while hindering work quality and hoping for a quick payout. This type of thought process and attention to detail is a cornerstone philosophy amongst all the world’s best geologists and exploration teams.
The Canadian ticker symbol for Liberty Gold is LGD.TO and is a buy first tranche (25% of your desired allocation) under CAD$0.50 per share.
Then be patient to buy your second 25% desired allocation under CAD$0.45.
The US listing is LGDTF, and the buy under recommendation for the US listing is $0.45 per share.
The reason I have the 25% first tranche is to have a small position up to CAD$0.50. If the company is able to sell the Turkish assets sooner than I expect, the stock will pop above CAD$0.65 and at least we have a respectable gain on a small position. But if the company doesn’t sell their Turkish assets by year end, Liberty will experience tax loss selling, and I would like to use that selling pressure to increase my position Under CAD$0.45 per share.
The Valley of Darkness – Trek Mining
About this time last year, I recommended investing in JDL Gold, which went on to become Trek Mining. I also made it one of my largest personal holdings.
As a quick refresher, Trek owns a former producing gold asset in the re-development stage, located in Brazil. It also owns a very promising copper project called Ricardo, which is located in Chile. Trek also has a world-class management team, plus a board that includes mining legends David Lowell and Jim O’Rourke.
Despite all the positives here, Trek has been one of the most frustrating investments of my career. We paid CAD$2 per unit in the financing. The stock is below CAD$1.10 as I write.
I want to emphasize to every subscriber that Trek Mining is a core position in my portfolio. I also plan on substantially increasing my position in the company in the coming months. I believe the stock has found its low. I’ve taken to calling the past year with Trek “walking through the Valley of Darkness.” It’s been frustrating to see a company with such great assets and such great potential suffer such a large decline in share price. It’s been tough to watch my personal net worth decline by a large amount. If you invested in Trek, I know you’re unhappy as well. You should be.
However, I believe that after walking through the Valley of Darkness, Trek investors are very close to walking into the light. As I stated
months ago I was hoping that the funds who participated in the CAD$2 financing who had to sell would sell at CAD$0.90 or less.
I have accepted that I will most likely not be able to buy more stock under CAD$0.90. I believe the share price has bottomed in the CAD$1-CAD$1.10 area. That said, we are entering tax loss season and TREK may be under tax loss selling pressure. I want subscribers looking to buy or increase their position in TREK to do so slowly under CAD$1.10.
I also will look to increase my position under CAD$1.10, but will do so slowly over the next few months.
From a company standpoint, Trek has a great near-term producing gold mine. I have gone through the mine’s Bankable Feasibility Study in detail (it’s a 450-page report) with David Laing, Trek’s Chief Operating Officer, and I am very happy with the plan. The mine’s economics at $1,250 gold are very solid.
More importantly, the exploration upside is significant, and I believe the mine life will double, at a minimum. That will add significant value to the company.
Again, Trek also has a very good copper project in Ricardo that I have always believed a major will want to farm into. The project was one of legendary geologist David Lowell’s discoveries, and I think there is significant potential there. As the copper prices works higher, so will interest in Ricardo.
Trek currently has a CAD$180 million market cap with CAD$85 million in cash and no cash debt. It is without a doubt the world’s cheapest publicly-listed development gold story. To my institutional readers: Trek’s current low price is an incredible opportunity to add a cheap, high-quality gold and copper company to your portfolio.
I believe the market will eventually figure out the value in Trek. Until then, I will add to my position.
I am fully aware that many subscribers are unhappy with the share price performance with Trek. And you should be. It’s been awful. I ask you to give Trek some time, because I believe this stock will surprise a lot of people on the upside.
BUY UNDER CAD$1.10.
Portfolio Updates
Aurvista Gold (AVA.V)
With CAD$8.5 Million in cash and no debt, I expect the new management team to start preparing for a major drill program.
At the recent Sprott Conference in Vancouver, Robert Friedland had a one-hour keynote time slot at the conference. If you know Robert, then you know that he rarely can talk for only one hour. Robert loves the sound of his voice.
In an unusual move for Friedland, he invited David Broughton up to the stage during his keynote and shared the stage with him.
David Broughton is Friedland’s geologist guru who is responsible for the massive discoveries within Ivanhoe Mines. David was awarded the two top geology awards, PDAC’s Thayer Lindsey and AME BC’s Colin Spence, for his world-class discoveries at the Kamoa project in the Congo and the Platreef project in South Africa. Robert Friedland calls David a living legend and a genius.
But what a lot of people do not know is that David worked extensively in the Abitibi belt, very close to where Aurvista’s Douay gold project is. David Broughton would not have joined the board of Aurvista, nor would he get so involved, unless he thought there was a serious shot at a world-class gold mine.
I reiterate my BUY UNDER CAD$0.30 that I have previously stated.
We will be publishing a video interview with Aurvista’s management team by Thanksgiving.
Alterra Power Corp (AXY.TO)
No new business developments or significant share price moves to comment on.
BUY UNDER CAD$5
Blackbird Energy Inc. (BBI.V)
No new business developments or significant share price moves to comment on. But please make sure to read
my letter to Montney CEOs about the exceptional opportunity with Blackbird.
BUY UNDER CAD$0.35 for new subscribers (guidance hasn’t changed from last months report).
Silver Run Acquisition Corp II
Silver Run Acquisition Corp II is a company that raised $1 billion through its initial public offering (IPO) in March 2017. Silver Run’s CEO is Jeff Hackett, who ran Anadarko Petroleum. Anadarko currently has a market capitalization of approximately $23 billion. Jeff is the real deal and I fully expected him and his team to go after some big onshore oil and gas assets.
I was proven correct last week. Jeff and his team entered into definitive agreements to acquire the private oil and gas producer Alta Mesa Holdings and Kingfisher Midstream.
Alta Mesa Holdings has a large acreage position in the up and coming STACK region of Oklahoma. Alta Mesa expects to produce 20,000 barrels of oil equivalent (boe) per day by the end of this year. The company’s goal is to produce over 60,000 boe per day by the end of 2019. This is a lofty goal, but given management’s previous success, I believe it is achievable.
Kingfisher Midstream is an oil and gas pipeline company that operates in the STACK region of Oklahoma. Kingfisher Midstream will provide the gathering and transportation of Alta Mesa’s production. Initial guidance from company management pegs Kingfisher’s 2019 Earnings Before Interest Taxes Depreciation and Amortization (EBTIDA) at over $300 million.
The deal between Silver Run Acquisition Corp II, Alta Mesa Holdings, and Kingfisher Midstream is expected to close by end of 2017. Upon the close of the transaction, Silver Run II is expected to be renamed Alta Mesa Resources, Inc. and trade on the NASDAQ stock exchange under the ticker symbol “AMR.” Stay long.
BUY UNDER $10.25
Wheaton Precious Metals
Wheaton Precious Metals released its Q2 2017 financial statements. Revenue decreased 6% compared to the second quarter of 2016. The stock dropped on the results, not because of the revenue miss but because of the precious metals streaming agreement on the San Dimas mine in Mexico. San Dimas is operated by Primero Mining. It’s no secret Primero has struggled to reach constructive agreements with workers who have been going on strike at the mine. Furthermore, Primero has struggled to find new silver veins to replace diminishing silver reserves.
Fortunately for Wheaton Precious Metals shareholders, this is one of many high-quality streams or royalty agreements which create revenue for the company. Wheaton Precious Metals increased its dividend payout percentage by 43% this quarter. Management would not have boosted dividends by 43% if it believed the company was in trouble.
HOLD
Sprott Resource Holdings
Rick Rule and his team at Sprott Resource Holdings acquired a 70% interest in S.C. Minera Tres Valles (MTV) for $33.5 million in cash and $6.4 million worth of Sprott Resource Holdings shares. Minera Tres Valles is a fully permitted, operating copper mining complex located in the Salamanca region of Chile. MTV produced 6.5 million pounds of copper in the first half of 2017.
At first blush, this project doesn’t seem that big. Rick believes in his team, and is supporting his team on this acquisition, but don’t forget that Rick Rule is extremely smart and ruthless and if he didn’t believe his team is onto something big, there is no way he would allow them to spend $33.5M on a small operating copper mine.
I believe the business plan is to consolidate small to mid-tier sized operating copper and gold mines that are owned by private groups in the Americas. I’ve seen many groups try this plan and fail in the past. Enough experience in the industry has made me commit to avoid small mines moving forward. A mine, regardless of the size is always a big headache. Thus, if I am going to stick around for the pain, I want the gain to be on a world class scale.
MTV was previously owned by Vale, one of the world’s largest base metal companies. Vale invested over $240 million into the complex from 2005 to 2013. MTV has a large land package composed of more than 44,000 hectares. The asset currently hosts a JORC compliant resource estimate of 40.7 million tonnes of copper, at an average grade of 0.8%.
We will give Rick Rule and his team six months to see how they monetize and increase shareholder value.
Rick has stated that he is going to start buying stock in the open market soon. The amount of stock Rick purchases will give us a good idea how much he believes in his team and projects very soon.
Post transaction, Sprott Resource Holdings remains very well capitalized with roughly $35 million in cash.
HOLD.
Skyharbour Resources
Skyharbour Resources is currently amidst its summer drill program at its flagship Moore uranium project. Given the success of Skyharbour’s first phase of drilling at the Moore project in the winter of 2017, the company has planned for a 2,500-metre summer drill program to commence in August. Drill targets will include several regional targets at the property as well as the Maverick corridor, where previous drilling has intersected high-grade uranium mineralization.
HOLD
Uranium Energy Corp
Uranium Energy Corp closed its previously announced acquisition of the Reno Creek uranium project located in Wyoming. Reno Creek is another project owned by Uranium Energy Corp, which employs the in-situ recovery (ISR) technology. In-situ recovery is the cheapest form of uranium recovery in the world. Average production costs are around $20 per pound. Even in a brutal market like we face today, Uranium Energy Corp President and CEO Amir Adnani continues to find ways to create shareholder value.
HOLD
Below is the current Katusa Resource Opportunities portfolio.
Thank you for being a member of Katusa’s Resource Opportunities. I look forward to writing you again soon.
Regards,
Marin
Disclosures and Disclaimers
Marin Katusa, Katusa Research Inc. (“Katusa Research”), New Era Publishing Inc. (“New Era”) and/or the other principals, partners, directors and officers of Katusa Research or New Era (the “Katusa Research Team”) own securities positions in, and are long on, the following companies mentioned above: NSU, WPM, AVA, SRHI, SYH, UEC, AKG, TREK, BBI, NDM, AXY, LGD
Additionally, members of the Katusa Research Team currently intend to acquire securities in the following companies mentioned above: NSU, SRUN, WPM, AVA, SRHI, SYH, UEC, AKG, TREK, BBI, NDM, AXY, KAT, LGD
No members of the Katusa Research Team have received any commission or other compensation to feature any company mentioned in this newsletter nor are they party to any financial arrangement regarding the securities of such companies or any person who has any interest in such securities. The information contained in this publication is not intended and does not constitute individual investment advice and is not designed to meet your personal financial or investment situation or needs. Neither Marin Katusa nor Katusa Research are registered broker-dealers or financial advisors. Never make an investment based solely on what you read in an online newsletter, including this newsletter, especially if the investment involves a small, thinly-traded company that is not well known. Past performance is not indicative of future results. You should independently investigate and fully understand all risks before investing. When investing in speculative stocks, it is possible to lose your entire investment. Information contained in such publications is obtained from public sources believed to be reliable, but its accuracy cannot be guaranteed. Further, the views expressed herein are of Katusa Research as of the date hereof, are subject to change and the Katusa Research Team does not undertake any obligation to update such information or views. None of the members of the Katusa Research Team shall be liable for any damages, losses, or costs of any kind or type arising out of or in any way connected with the use of this newsletter. The information in this publication reflects the current opinion of the publisher, is subject to change, and may become outdated. The publisher undertakes no obligation to update any such information.
Unauthorized Disclosure Prohibited. The information provided in this publication is private, privileged, and confidential information, licensed for your sole individual use as a subscriber. Katusa Research reserves all rights to the content of this publication and related materials. Forwarding, copying, disseminating, or distributing this report in whole or in part, including substantial quotation of any portion the publication or any release of specific investment recommendations, is strictly prohibited.